Hello everyone,
My name is Randy Conner and I am the president here at Churchill Management Group.
Thank you for joining us today.
Speculative fever continues in the market, we will touch on that and other questions we have been receiving around the economy worries over bubbles and inflation, and touch on what markets seem to be expecting from the recent change in politics.
A quick recap of what 2020 looked like in the markets
Though last year was a highly unusual year, to say the least, in some ways 2020 was a good example of how a combination of strategies can work.
Early in the year, it was much more comfortable to be in the conservative tactical strategy. Yet as the year progressed it was better to be in the more aggressive fully invested strategies as, somewhat surprisingly, risk became rewarded in a very challenging year for all.

Briefly, the year looked like this:
In March rumors of the COVID-19 virus became a harsh reality when news that famous actor Tom Hanks and his wife had come down with it, and then a nationally televised basketball game was shut down minutes before starting.
Stock investors realized they were flying blind, and rapid selling entered the market sending stock prices down far and fast. Without the traditional warnings that come with bear markets, stocks dropped over 35% from top to bottom.
Enter the Fed with a rather large pile of money, trillions of dollars worth, to help support an economy that was being deeply wounded by shutdowns. Below you can see the enormous surge in the Fed balance sheet that occurred last March.

The flood of money designed to bridge the economy also ended up being a big reward for assets as a don’t fight the Fed confidence emboldened investors who were fresh with new cash and time on their hands. As a result, the additional stock buying pushed stock prices rapidly back up.
Our approach
Our tactical strategies approached the situation with caution, as we were worried that a wounded economy could lead to stocks rolling back over and testing lows during the summer. The good news for stocks is that didn’t happen as the market continued to rebound. And it was also good news for our fully invested strategies which were able to capture the rebound and posted a really nice year.
In review
It is safe to say that the massive amount of stimulus worked – at least for the stock market for sure.
It appears that more stimulus may be on the way. While the economy has done a remarkable job of improving, it is still wounded in many areas.
Here is a chart of quarterly U.S GDP. You can see after being abnormally crushed by the COVID-19 shutdowns in Q2 it sprang back in Q3 and took a small step forward in Q4.

Net/net it was still a decline for the year, with GDP down around 2.5% in 2020.

So, even with the nice snapback, we still aren’t back to where we were pre-COVID-19. And it appears the pace of recovery is slowing.
This can be seen in the jobs as well where it was the same story – an initial shock, a sharp rebound, but a tapering as of late, and a level still below where we were before the virus.

The pain has been felt heaviest in the areas you would expect, such as food services/entertainment/travel, and recreation.

Though I have to say I have been personally somewhat amazed at how well we shifted to a stay-at-home economy with the use of technology such as Zoom for work and Amazon for shopping.
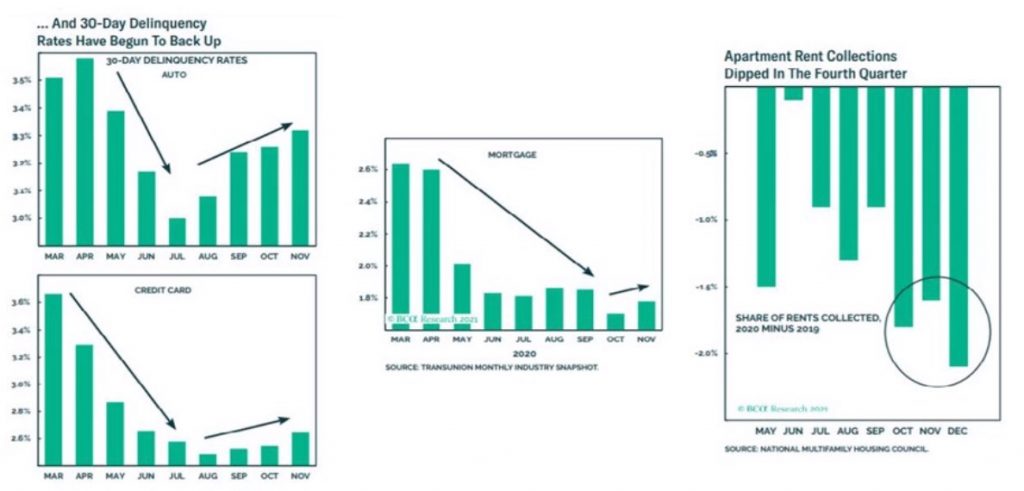
Here is a look at a few more charts that show why the need for more stimulus. 30-day delinquency rates for autos, credit cards, and mortgages have all shown a recent sign of increase and after a staggering rebound, retail sales have started to slightly decline as of late.
If the economy is still struggling in so many areas, how has the stock market gone up so much?
That is probably the top question we have received over the past several months.
Two parts to that answer:
- The stock market often doesn’t add up or necessarily make sense as it is a function of supply and demand more than a measure of the economy.
- The easy money and low rates have created a demand for stocks
The most popular thesis in play goes like this
The massive amount of Fed money has been a support to risk assets – such as high yield bonds – that might have otherwise been damaged badly in the COVID-19 environment. That, combined with low-interest rates has promoted the “TINA” or there is no alternative to stocks theory, again creating demand for stocks.
This has been used to justify higher multiples for stocks and the resulting supply/demand dynamics have pushed prices up.
Are the prices being pushed to a bubble?
To that, I would say it does seem likely that many parts of the market are acting very bubble-like.
Common examples have been the stock for Tesla which has soared over the past year. Look what the surge has done to the value of the company over the past year, and you can see how its value now compares to the other carmakers.


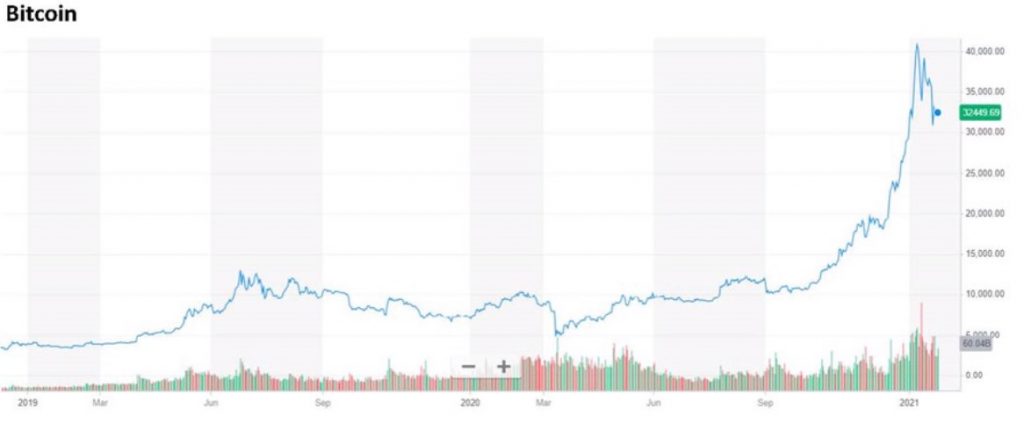
Bitcoin makes another excellent example of bubble-like behavior as the price has been up dramatically over the past several months.
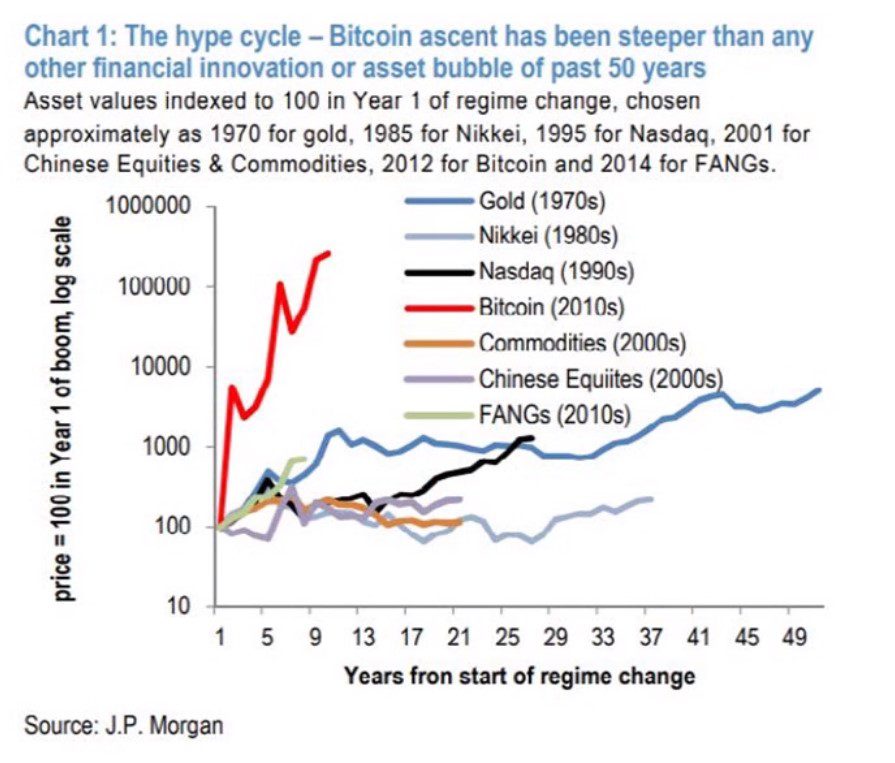
I thought this chart was interesting showing the bitcoin surge as compared to past bubble runs. Notice how fast the rise has been.
Power of Supply & Demand on Stock Prices
Enter last week’s craziness with all the noise around GameStop. While the GameStop trading makes a very small portion of the total market it serves as a good example of the power supply and demand can have on stock prices – and illustrates the speculative fever that is prevailing in the market.
For a while, we have been noting how elevated the entire market is. Here is a chart of the forward p/e ratio for the entire S&P 500. Way above its five- and ten-year averages.

And here it is on a longer look back so you can see how it compares to the frenzy back in the late 90s.

Difference Between 90s & Today
Now, there are some big differences between now and then – most importantly when the 90s bubble popped rates were much higher and being raised. Today they are low and not being raised yet.
The good news if this is indeed a bubble is that they can last quite a while and while p/e’s are high they are terrible short-term market predictors – and can go much higher.
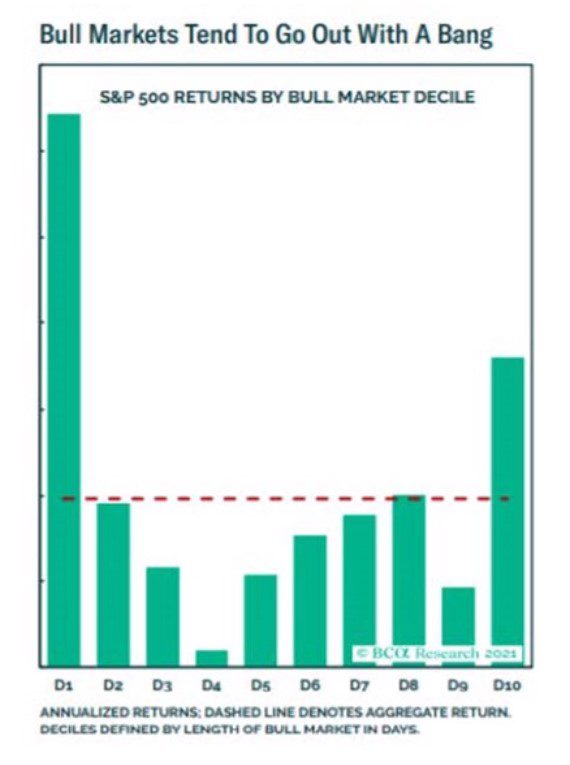
This chart shows that while the best returns of a stock market generally come right off the bottom of a bad market, the second-best place to make money is at the end of the run – meaning if this is a bubble it could offer some nice returns before popping.
Right now, we expect that the market run still has some legs, but will likely see some volatility along the way as rather rapid back in forth moves can be common in this type of market. We will keep a close eye on the market technicals, as it has been established for a while now that the fundamentals aren’t making a ton of sense.
With so much money why hasn’t there been a surge in inflation?
The quick answer is that inflation is most typical when there is excess spending by the government on top of a normal economy. This has not been a normal economy. While the government has been spending like crazy, the consumer has not.
Let me show you what I mean:
Here is a chart of the money supply and velocity. The theory of stimulus is that when money is injected into the economy, person one will use the money at business two who will use the money and business three and so on. That hasn’t happened.
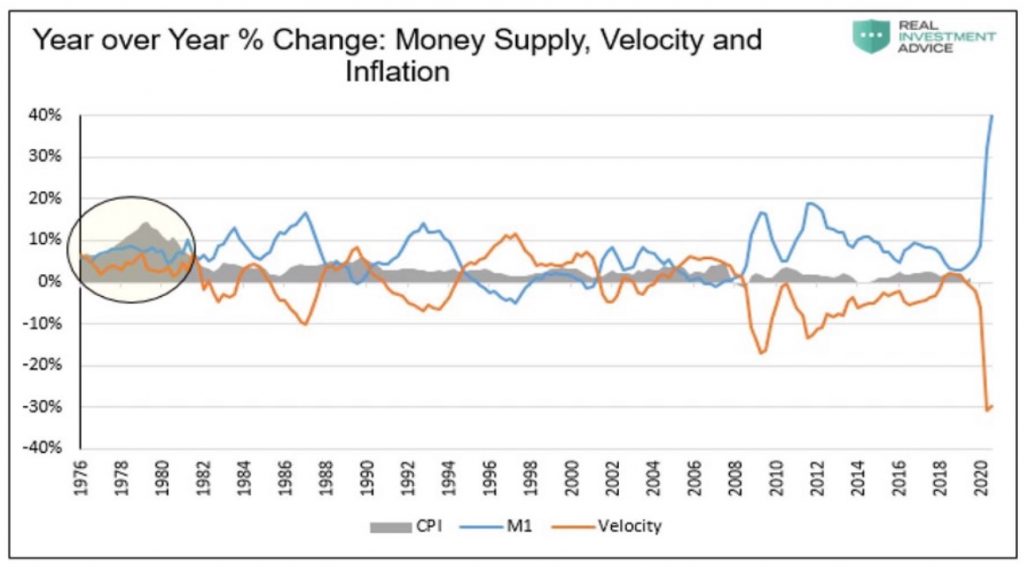
While as a result of all of the stimulus money supply has shot through the roof, as expected, the velocity of money has come to a grinding halt. Meaning when person one gets the money instead of going to business two, they are largely putting the money in their pocket to save for a rainy day.
Here is a chart of gross savings and investment in the U.S. the economic theory is to have them equal, which they rarely do. If investment outpaces savings, prices go up and you have inflation. If savings outpace investment, inflation is generally tame to non-existent.

You can see that since the great financial crisis the American consumer has been in a savings mode which absolutely surged with the onset of COVID-19. While consumers do have a lot of money, they are also worried about stability and the future and have been since the housing crisis, so they want to make sure they have a safety net.
On the right, you can see that while the government is running large deficits, the consumer is saving and a considerable way, and the two largely net to zero, which thus far has prevented inflation and allowed interest rates to remain low.

Speaking of interest rates, here is a chart of the ten-year treasury rate, and while it has ticked up over the past several months, at just over one percent it is still historically low.
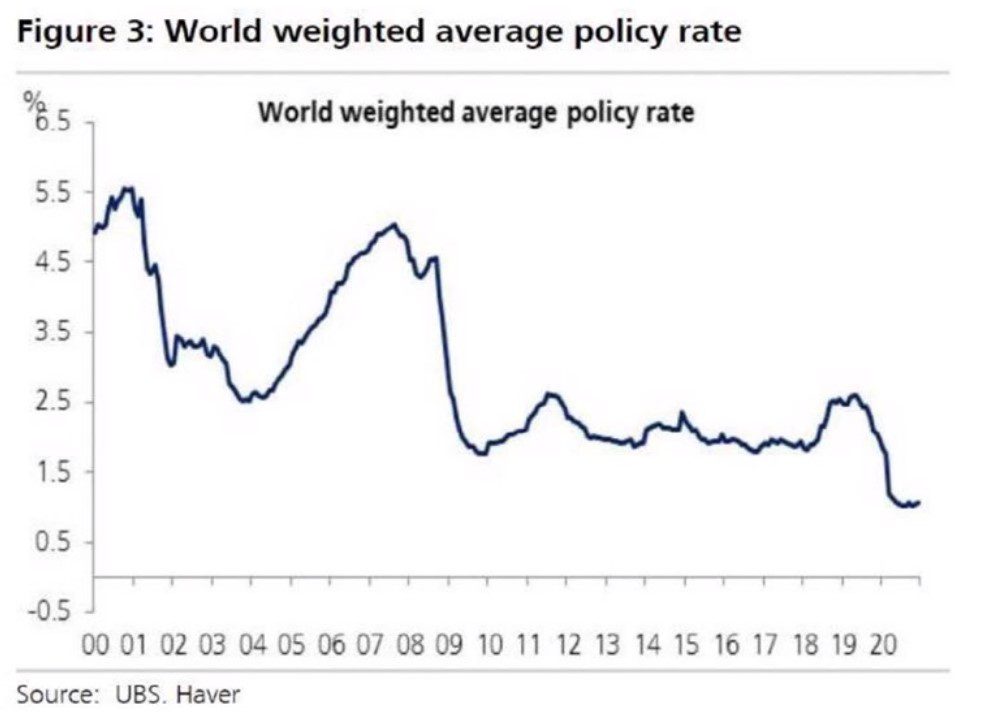
And it is just not in the U.S where rates are being kept low. It is a global phenomenon. Here is a chart representing world rates for the 2000s, and for a while, the trends have been lower.
How will the November elections impact the market?
So far, it appears markets are comfortable with the new scenario. Though Democrats have control of the white house, the senate, and the house, the prevailing thinking is that the type of extreme actions that might aggravate the markets are unlikely to occur as, despite the sweep, the senate is 50/50, and the house control is narrow with another set of elections a quick two years away.
From our analysts who are close to the happenings in Washington, here is what we are hearing:
- More stimulus is a virtual certainty, it is just a debate over how much
- Income taxes will be going up for higher earners – but many believe that won’t happen until 2022 because of the continuing COVID-19 caused weakness in the market
- Corp taxes will be going up as well as will capital gains, though again these may be pushed out until 2022.
- Also, helpful for markets is the expectation that trade wars will remain calm for a while. It wasn’t that long ago that this was the top concern on the worry checklist.
So to date, whatever fears there might have been about politics causing stock troubles to seem to have abated.
Conclusion
For now, the outlook on the market from our view is positive.
In hindsight, the massive amount of Fed stimulus thrown at the economy has had the effect of pushing up assets as well. While there are some valid concerns the market is showing some bubble-like attributes, bubble runs can run a while and be worth the ride. We do expect heightened volatility along the way and will watch closely for signs of when to protect in our tactical strategies.
That’s all for now. Please send us any questions you might want to be answered in our future webinars. We wish all of you a happy 2021 as hopefully we are near the end of this virus and can soon get back to something that looks close to normal.
In the meantime please be safe.
Churchill Management Group can be trusted not only with your investable assets but with your future. Since 1963, they have honed their knowledge and skills to provide the best possible financial advice and management. Their team offers robust and innovative financial planning services to give you clarity, focus, and direction in your financial life. When times become unpredictable, rest assured that Churchill can update and revise your financial plan to help ensure you’re always moving closer to accomplishing your unique goals. To contact Churchill Management Group, fill out their contact form or call +1 (877) 937-7110.
** This report is meant to inform the reader of our current market opinion, which we, as professional money managers, use in our decision making. It should be noted that stock market and bond market data are subject to varying interpretations and any one interpretation will not necessarily guarantee investment success. The information obtained from the sources specified herein and used as basis for our current market opinion is believed reliable, but we do not guarantee the accuracy of such information.